Retrieving information about processing units of requests
In this example notebook we show how to retrieve DownloadResponse and download headers at the same time, which can be used to approximate the use of processing units.
The tutorial assumes knowledge of Sentinel Hub Process API and Sentinel Hub Statistical API examples.
For more information about the service please check the official service documentation.
[1]:
# The following is not a package. It is a file utils.py which should be in the same folder as this notebook.
from sentinelhub import (
    CRS,
    BBox,
    DataCollection,
    MimeType,
    SentinelHubRequest,
    SentinelHubStatistical,
    SHConfig,
    bbox_to_dimensions,
)

from utils import plot_image

config = SHConfig()

if not config.sh_client_id or not config.sh_client_secret:
    print("Warning! Please provide the credentials (OAuth client ID and client secret).")
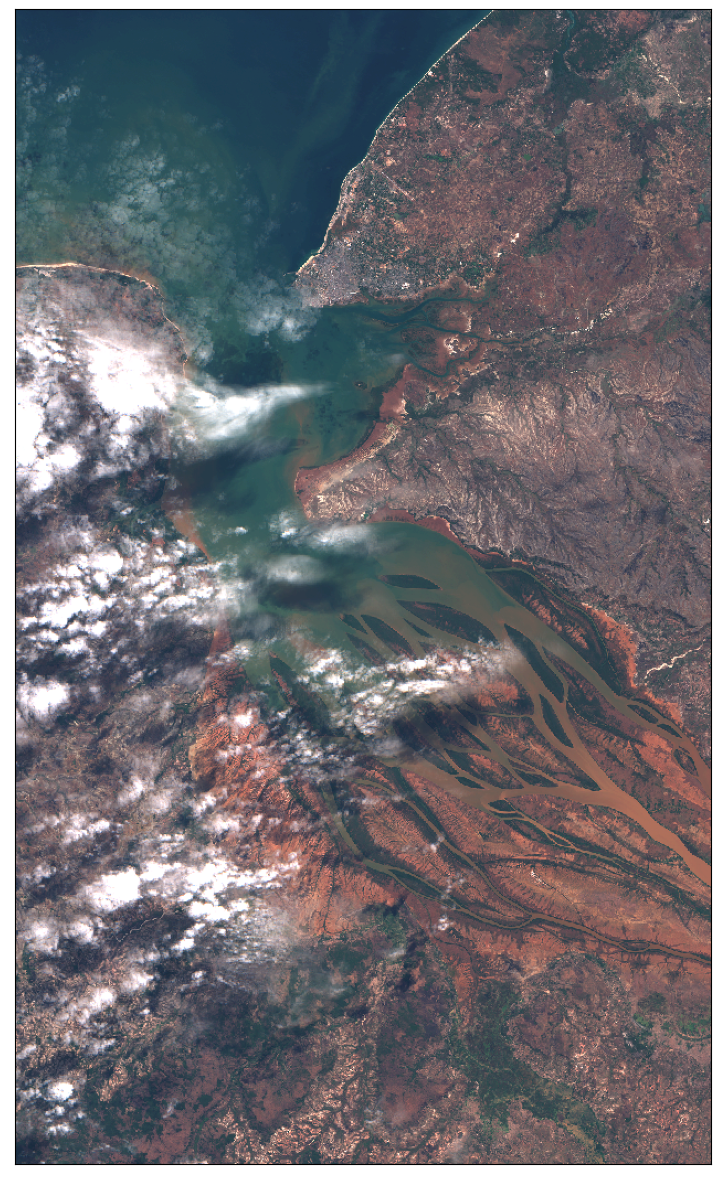
Let’s take the same bounding box of Betsiboka Estuary, used in Process API and Statistical API tutorial, to make a DownloadResponse request.
[ ]:
betsiboka_coords_wgs84 = (46.16, -16.15, 46.51, -15.58)
resolution = 60
betsiboka_bbox = BBox(bbox=betsiboka_coords_wgs84, crs=CRS.WGS84)
betsiboka_size = bbox_to_dimensions(betsiboka_bbox, resolution=resolution)
Sentinel Hub Request
[3]:
evalscript_true_color = """
    //VERSION=3

    function setup() {
        return {
            input: [{
                bands: ["B02", "B03", "B04"]
            }],
            output: {
                bands: 3
            }
        };
    }

    function evaluatePixel(sample) {
        return [sample.B04, sample.B03, sample.B02];
    }
"""

request_true_color = SentinelHubRequest(
    evalscript=evalscript_true_color,
    input_data=[
        SentinelHubRequest.input_data(
            data_collection=DataCollection.SENTINEL2_L1C,
            time_interval=("2020-06-12", "2020-06-13"),
        )
    ],
    responses=[SentinelHubRequest.output_response("default", MimeType.PNG)],
    bbox=betsiboka_bbox,
    size=betsiboka_size,
    config=config,
)
The following will send the request to Sentinel Hub service and obtain results.
By default the data gets decoded to an image (or other requested data).
We can set decode_data=False in the get_data method in order to obtain the Download Response object with headers.
[4]:
response = request_true_color.get_data(decode_data=False)
print(f"Response type: {type(response)}. List member type: {type(response[0])} ")
Response type: <class 'list'>. List member type: <class 'sentinelhub.download.models.DownloadResponse'>
The response is a list with a single member, if we want to obtain the headers we can access it as: response[0].headers. We can display info on how many processing units a request used.
[5]:
print("Response headers dictionary:")
[print(key, ":", value) for key, value in response[0].headers.items()]

print(f"\nProcessing units spent: {response[0].headers['x-processingunits-spent']}")
Response headers dictionary:
Date : Fri, 23 Sep 2022 08:55:22 GMT
Content-Type : image/png
Transfer-Encoding : chunked
Connection : keep-alive
access-control-allow-origin : *
access-control-allow-headers : origin,content-type,accept,accept-crs,authorization,cache-control
access-control-allow-credentials : true
access-control-allow-methods : GET, POST, PUT, DELETE, OPTIONS, HEAD, PATCH
access-control-max-age : 3600
x-processingunits-spent : 2.5202064514160156

Processing units spent: 2.5202064514160156
Responses obtained this way should be decoded by calling the .decode() method on them.
[6]:
decoded_image = response[0].decode()
plot_image(decoded_image, factor=3.5 / 255, clip_range=(0, 1))
Sentinel Hub Statistical
It is also possible to obtain response headers from Sentinel Hub Statistical.
[7]:
rgb_evalscript = """
//VERSION=3

function setup() {
  return {
    input: [
      {
        bands: [
          "B02",
          "B03",
          "B04",
          "dataMask"
        ]
      }
    ],
    output: [
      {
        id: "rgb",
        bands: ["R", "G", "B"]
      },
      {
        id: "dataMask",
        bands: 1
      }
    ]
  }
}

function evaluatePixel(samples) {
    return {
      rgb: [samples.B04, samples.B03, samples.B02],
      dataMask: [samples.dataMask]
    };
}
"""

rgb_request = SentinelHubStatistical(
    aggregation=SentinelHubStatistical.aggregation(
        evalscript=rgb_evalscript,
        time_interval=("2020-06-07", "2020-06-13"),
        aggregation_interval="P1D",
        size=(631, 1047),
    ),
    input_data=[SentinelHubStatistical.input_data(DataCollection.SENTINEL2_L1C, maxcc=0.8)],
    bbox=betsiboka_bbox,
    config=config,
)
[8]:
rgb_stats = rgb_request.get_data(decode_data=False)
print(f"Response type: {type(rgb_stats)}. List member type: {type(rgb_stats[0])} ")
Response type: <class 'list'>. List member type: <class 'sentinelhub.download.models.DownloadResponse'>
[9]:
print("Response headers dictionary:")
[print(key, ":", value) for key, value in rgb_stats[0].headers.items()]

print("\nProcessing units spent:", rgb_stats[0].headers["x-processingunits-spent"])
Response headers dictionary:
Date : Fri, 23 Sep 2022 08:55:34 GMT
Content-Type : application/json;charset=utf-8
Content-Length : 1188
Connection : keep-alive
access-control-allow-origin : *
access-control-allow-headers : origin,content-type,accept,accept-crs,authorization,cache-control
access-control-allow-credentials : true
access-control-allow-methods : GET, POST, PUT, DELETE, OPTIONS, HEAD, PATCH
access-control-max-age : 3600
x-processingunits-spent : 5.040412902832031

Processing units spent: 5.040412902832031
To get data out of the response, we again call the .decode() method on it.
[11]:
%%time
rgb_stats[0].decode()
CPU times: user 57 µs, sys: 35 µs, total: 92 µs
Wall time: 99.7 µs
[11]:
{'data': [{'interval': {'from': '2020-06-07T00:00:00Z',
    'to': '2020-06-08T00:00:00Z'},
   'outputs': {'rgb': {'bands': {'R': {'stats': {'min': 0.00419999985024333,
        'max': 0.7027999758720398,
        'mean': 0.1124257412122722,
        'stDev': 0.04222600867954154,
        'sampleCount': 660657,
        'noDataCount': 0}},
      'G': {'stats': {'min': 0.030400000512599945,
        'max': 0.5981000065803528,
        'mean': 0.09885213961499702,
        'stDev': 0.019804562978698967,
        'sampleCount': 660657,
        'noDataCount': 0}},
      'B': {'stats': {'min': 0.054999999701976776,
        'max': 0.5311999917030334,
        'mean': 0.10198085449414412,
        'stDev': 0.01494034416514153,
        'sampleCount': 660657,
        'noDataCount': 0}}}}}},
  {'interval': {'from': '2020-06-12T00:00:00Z', 'to': '2020-06-13T00:00:00Z'},
   'outputs': {'rgb': {'bands': {'R': {'stats': {'min': 0.004600000102072954,
        'max': 0.7160000205039978,
        'mean': 0.11546704480268109,
        'stDev': 0.06332157724593372,
        'sampleCount': 660657,
        'noDataCount': 0}},
      'G': {'stats': {'min': 0.03779999911785126,
        'max': 0.6126000285148621,
        'mean': 0.11290437308774512,
        'stDev': 0.048338260231641964,
        'sampleCount': 660657,
        'noDataCount': 0}},
      'B': {'stats': {'min': 0.05920000001788139,
        'max': 0.5658000111579895,
        'mean': 0.11913311262009575,
        'stDev': 0.04636540384197817,
        'sampleCount': 660657,
        'noDataCount': 0}}}}}}],
 'status': 'OK'}